Knowledgebase exploration in DES-RV
Introduction
Examples were extracted from the DES-rv KB, minor differences might exist for the other KBs build on DES.

Central to the knowledgebase is a notion of a “term” or “concept”. A term is a biological name or a phrase (e.g. Crohn’s diseases, autopphagy, T300A, etc.) used to mine the literature as illustrated in Figure 2. More detailed information about dictionaries can be found on the page "Dictionaries". Terms are organized into thematic dictionaries as shown in Figure 3. A term can be enriched by other data. Information sources like scientific papers and bioinformatics’ databases are analyzed, relevant terms extracted and recorded in the knowledgebase. In addition, connections between terms/concepts (in the knowledgebase called the “Enriched Pairs”) are inferred based on their co-occurrence. For example, terms “Crohn’s diseases” and “T300A” if mentioned in the same paper in a close proximity are co-occurring. Also, the knowledgebase system can infer hypotheticals. These hypotheses can be used as a starting point for possible further investigations. As a knowledgebase user, you will deal with terms: you can search the literature using them as keywords, you can list them, rank according to their relevance, find hidden relationships between them or ask the system to create hypotheses.
Knowledgebase Exploration
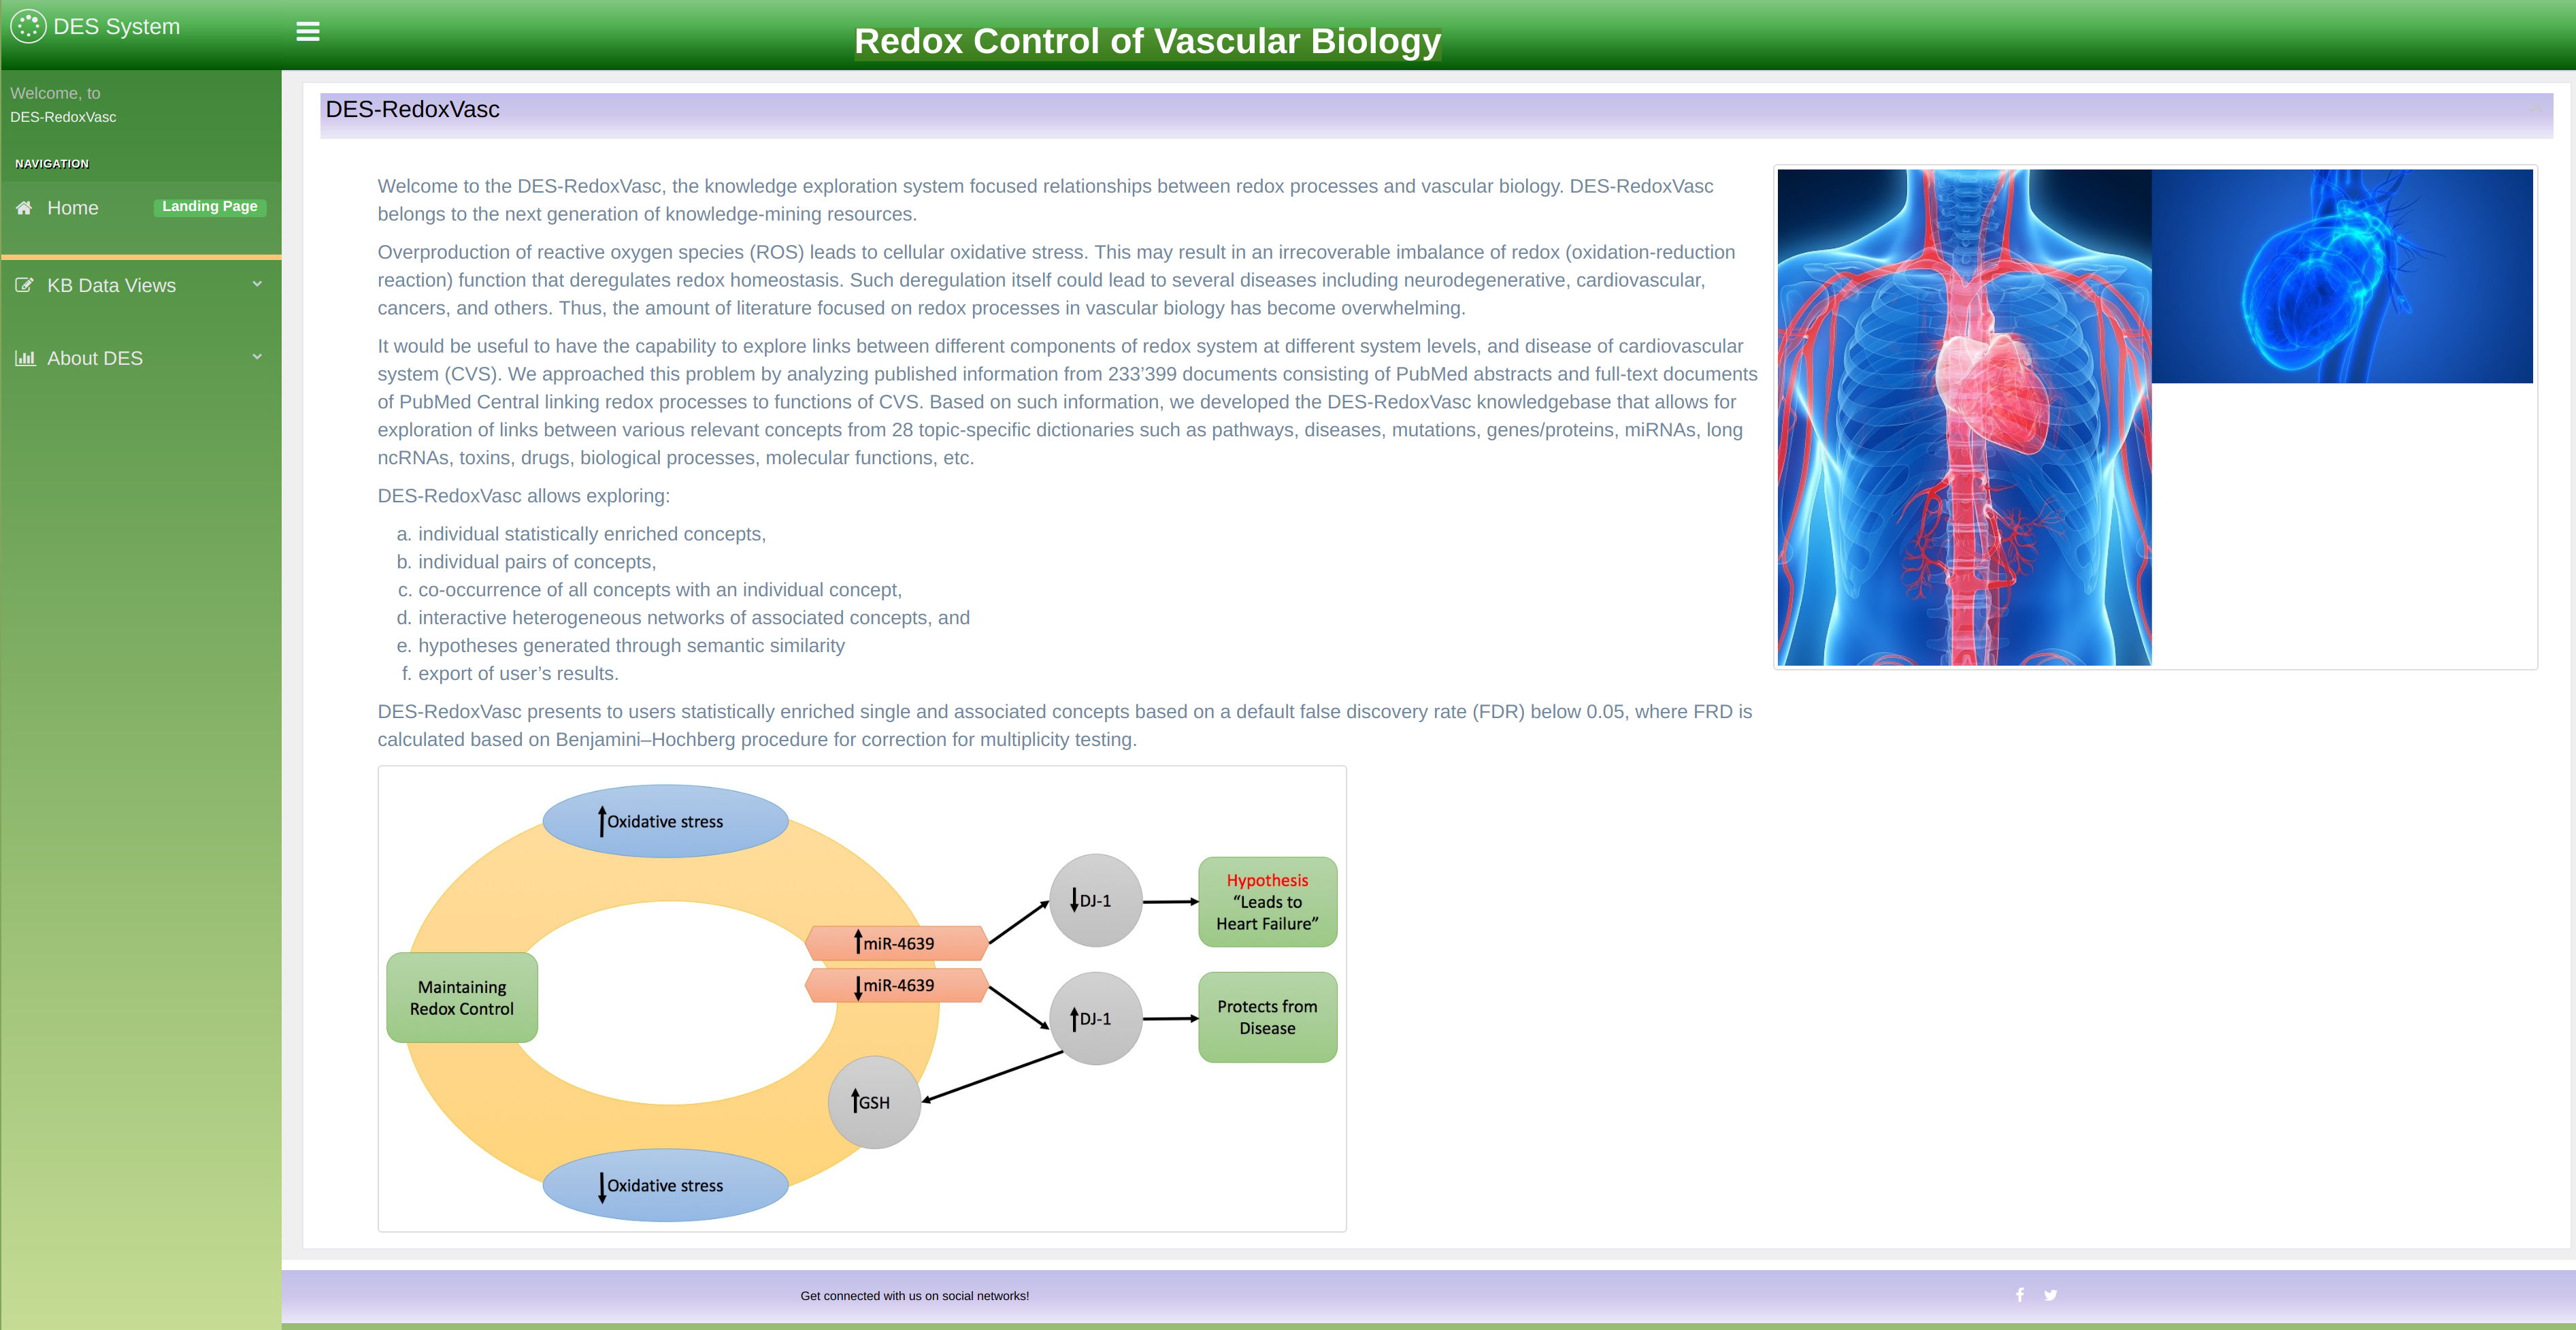
DES_rv is a web based application. To start exploring, inside your browser open the home page. This will take you to the knowledgebase opening screen as shown in Figure 4 for DES-rv. To navigate through the knowledgebase, you can use the main menu as shown in the figure 5.
Knowledgebase navigation and exploration modes
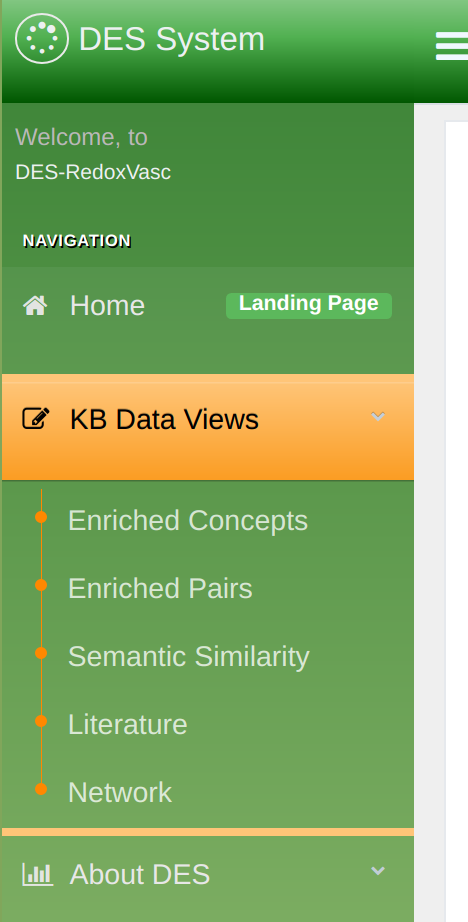
You can easily navigate through the knowledgebase by using the main menu as shown in Figure 5. After clicking on any of the options it will become highlighted and an appropriate exploration mode will open. The knowledgebase exploration modes are:
- Home: takes user to the knowledgebase home page.
- Enriched Concepts: shows list of terms enriched with information from various databases.
- Enriched Pairs: shows terms linked across multiple documents.
- Semantic Similarity: Explore semantically related concepts.
- Literature: enable literature exploration by using terms and dictionaries as keywords.
- Network: explore concepts through network interface.
- About DES: shows background information about the knowledgebase.
Enriched Concepts exploration mode
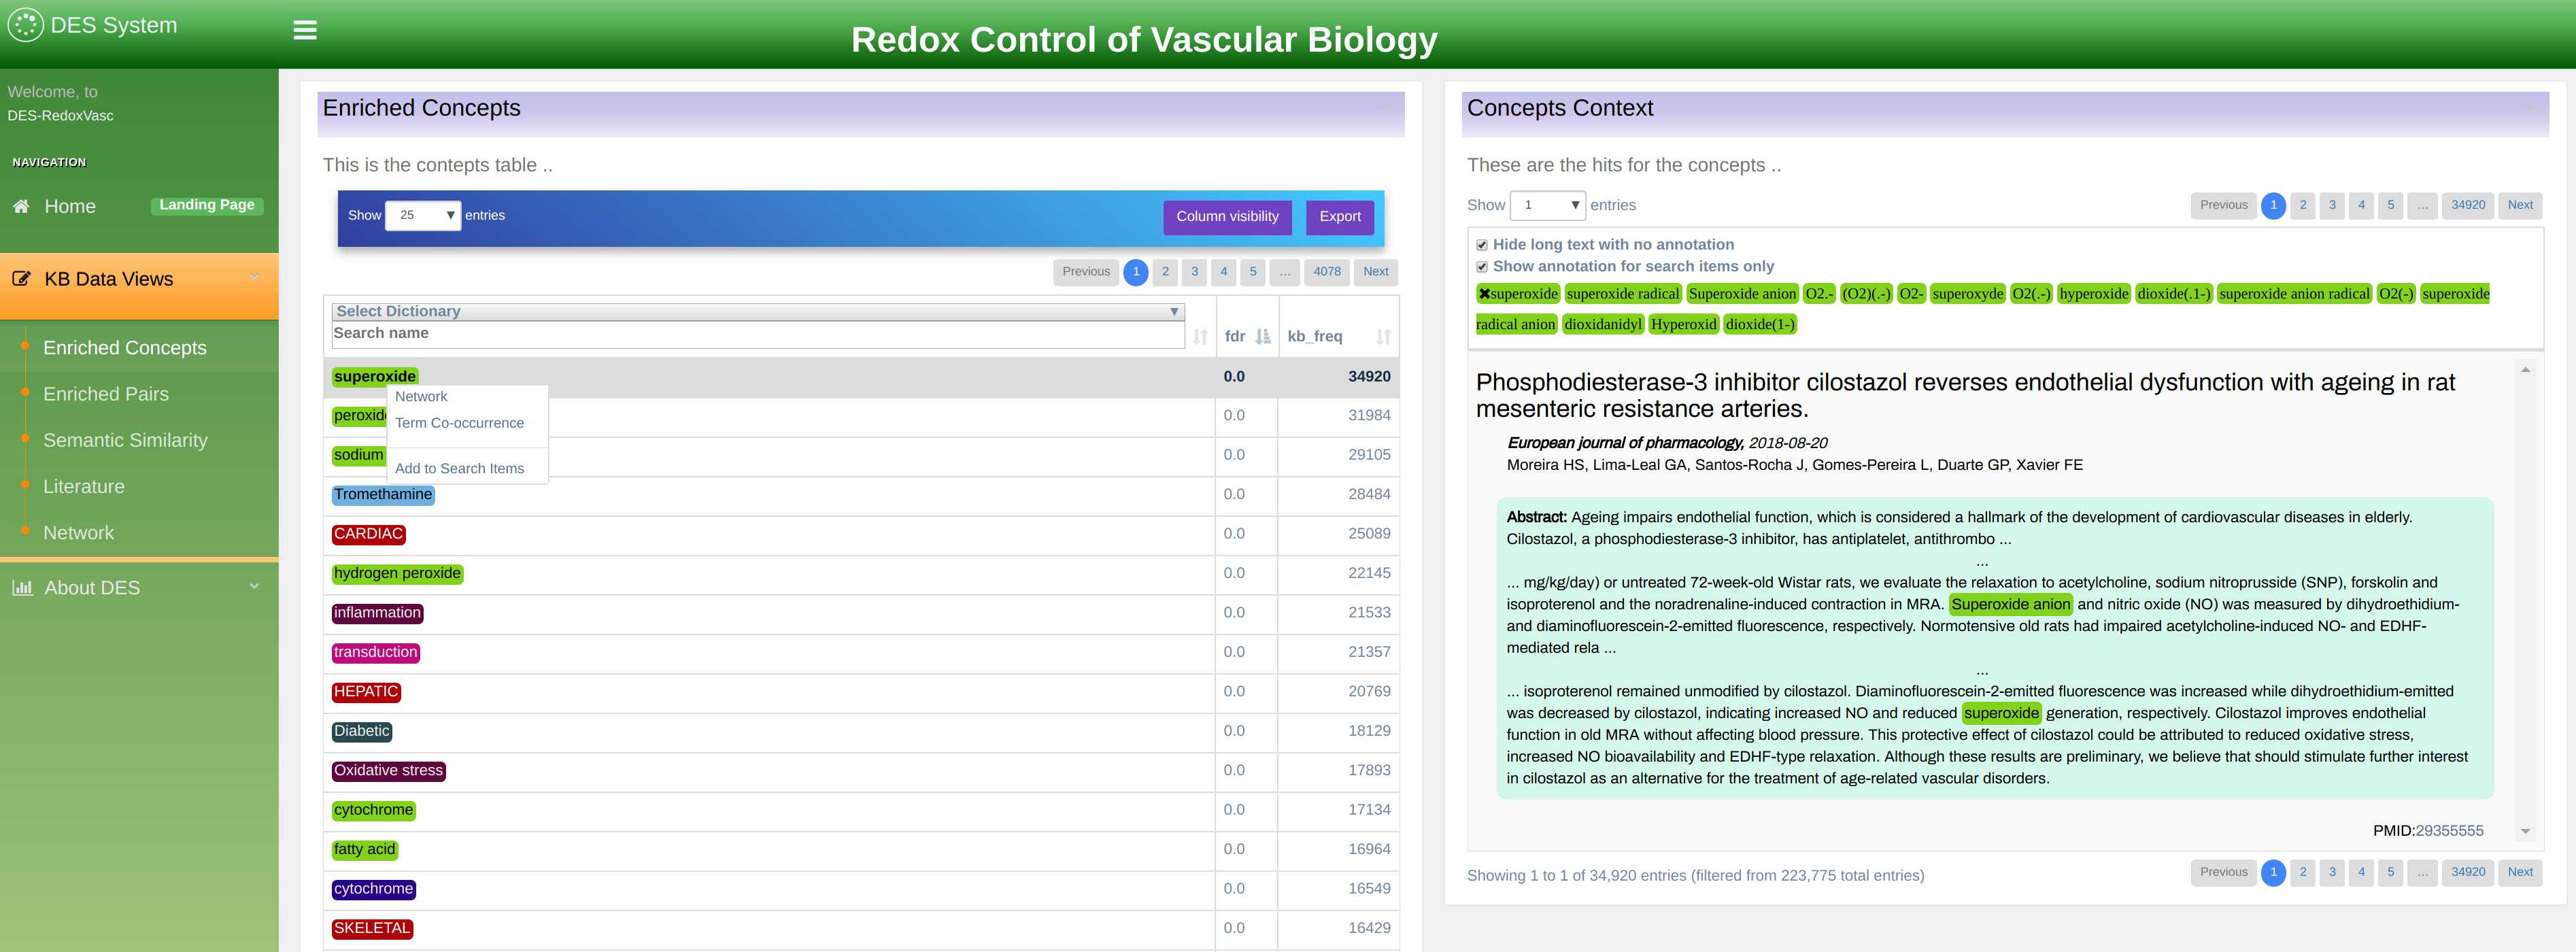
In this mode, you can explore terms occurring in the knowledgebase as shown in Figure 6. The terms are displayed in a table that can be sorted by any of the column by simply clicking on the column heading. Also, users can filter the list by any column by typing a keyword, or part of a keyword in the boxes above the table heading.
The following columns are available:
- FDR: False Discovery Rate shows rate of terms false detection. The p-values in this column are corrected using the Bonferroni-Hochberg method for multiplicity testing (FDR).
- KB Freq: knowledgebase frequency shows the count of all name variations of the term within this knowledgebase. By clicking on the frequency number a new window will open showing the literature in which a term has been found.
- PubMed Freq: The total count of all name variations of the terms within PubMed and PubMed Central.
- Dictionary: allows filtering terms by a dictionary.
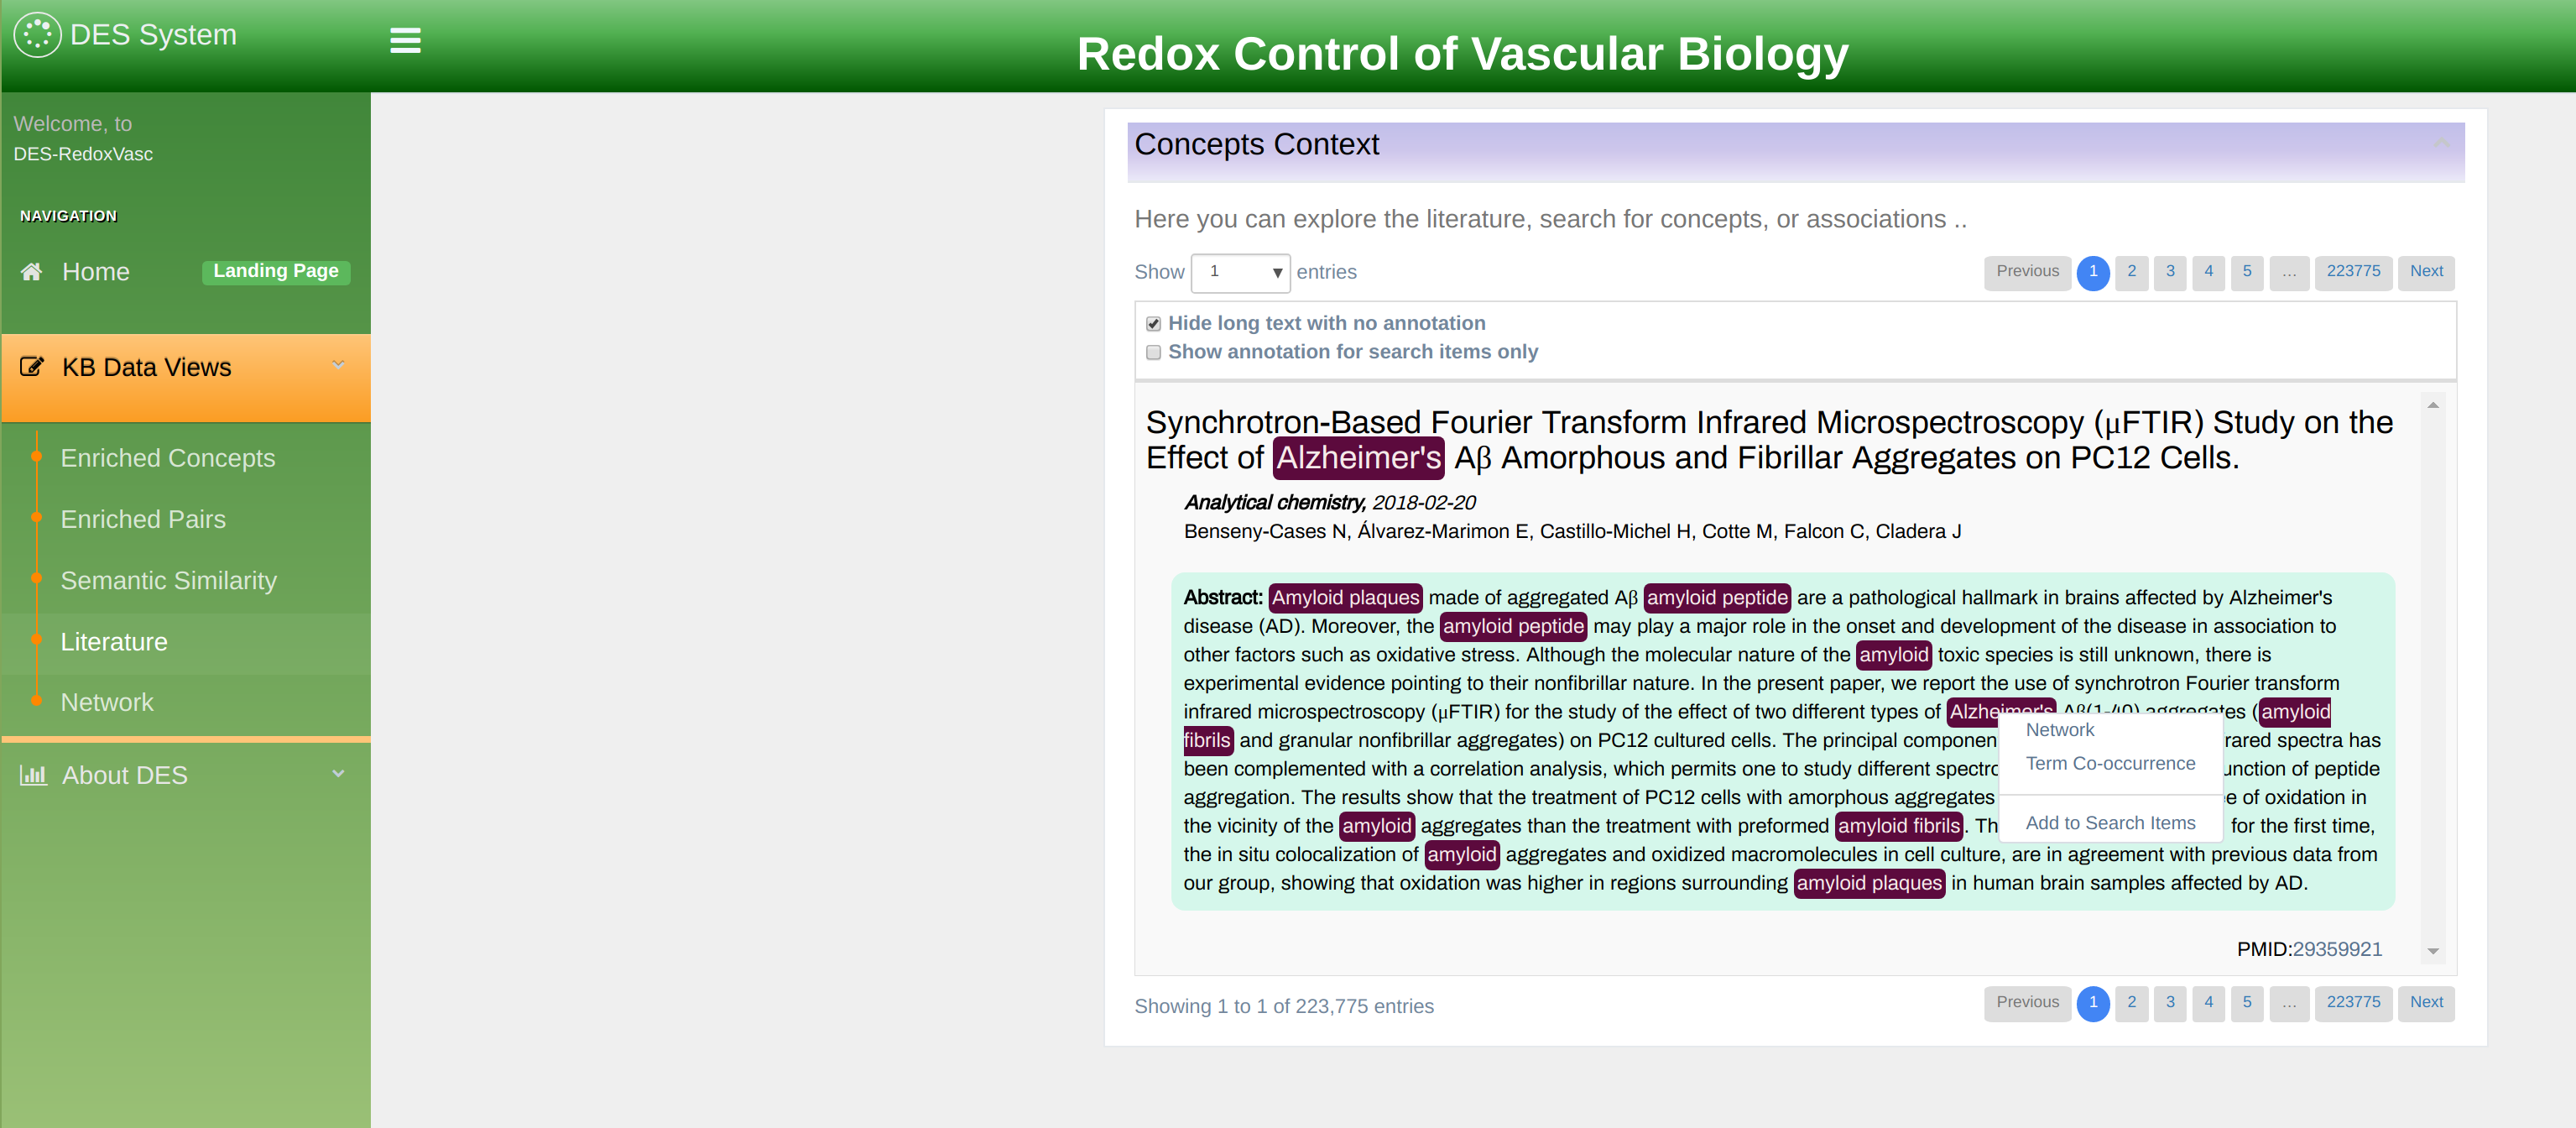
Right-click on a term’s name opens a visualization menu associated with the concept as shown in Figure 6. The menu has two options:
- Network: shows an interconnection graph between various terms.
- Term Co-occurrence: shows co-occurrences table i.e. list of other concepts that occur in the literature together with the selected one.
Here we explain the options in more details.
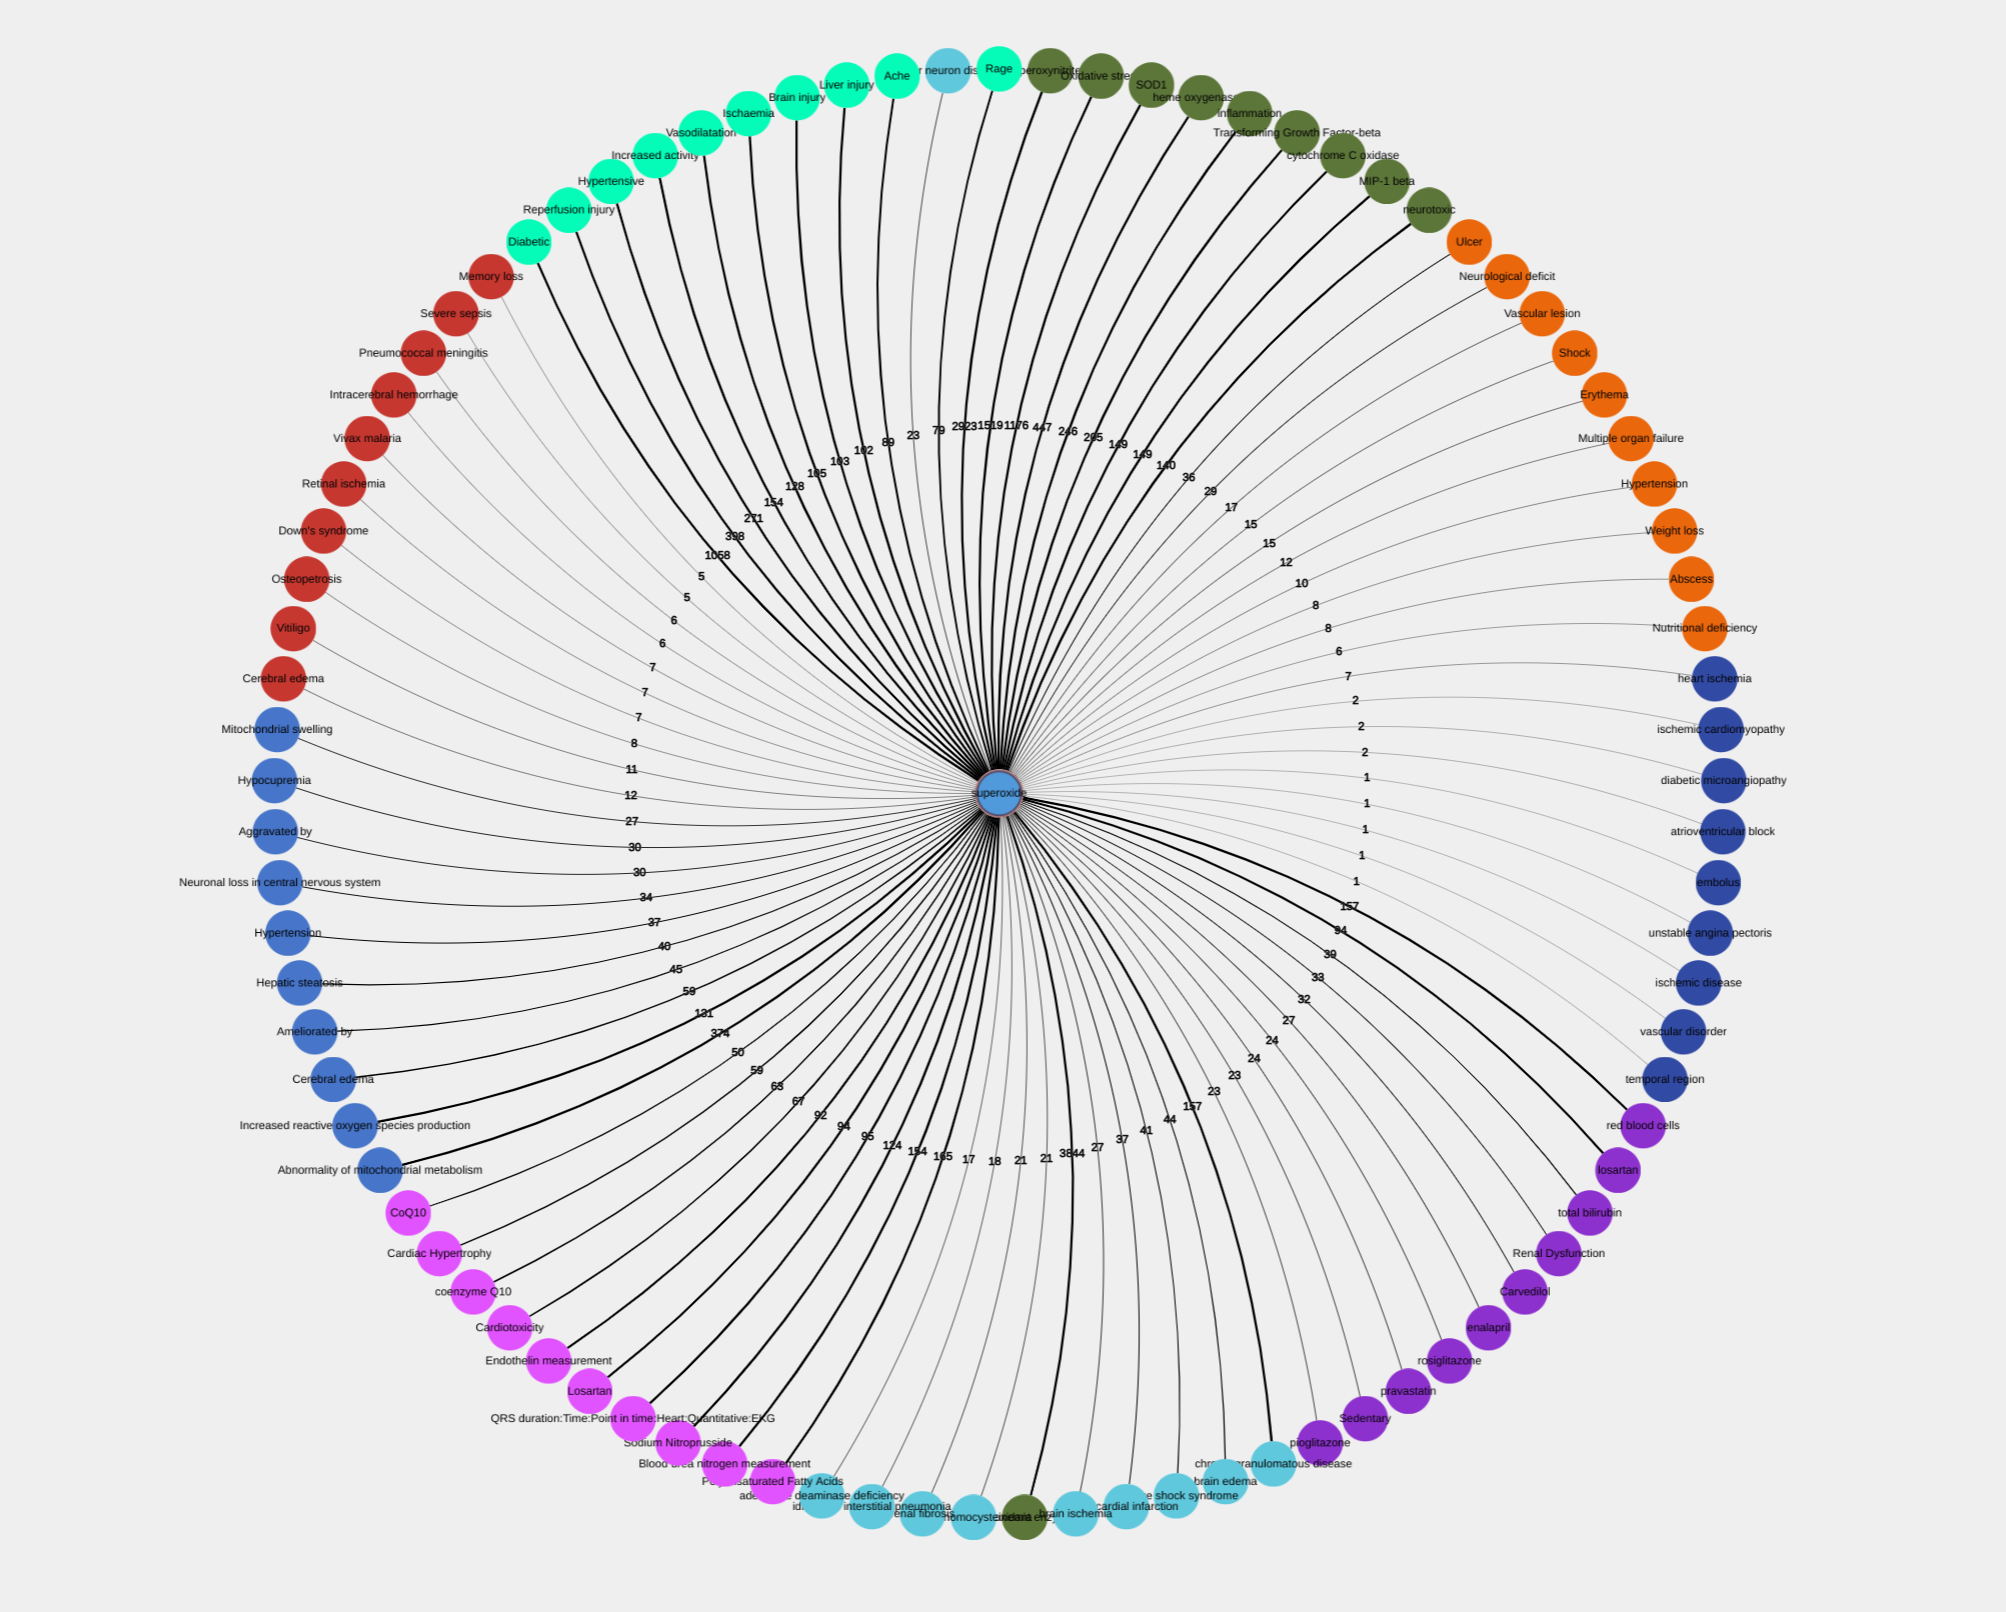
Network option
This option opens a visualization window as shown in Figure 7 showing an interconnection graph for top 50 terms. Each term on the graph is presented as a network node liked to another node via line labeled with a number of documents supporting the link. The graph can be explored in multiple ways, which we explain later.
Term Co-occurrence
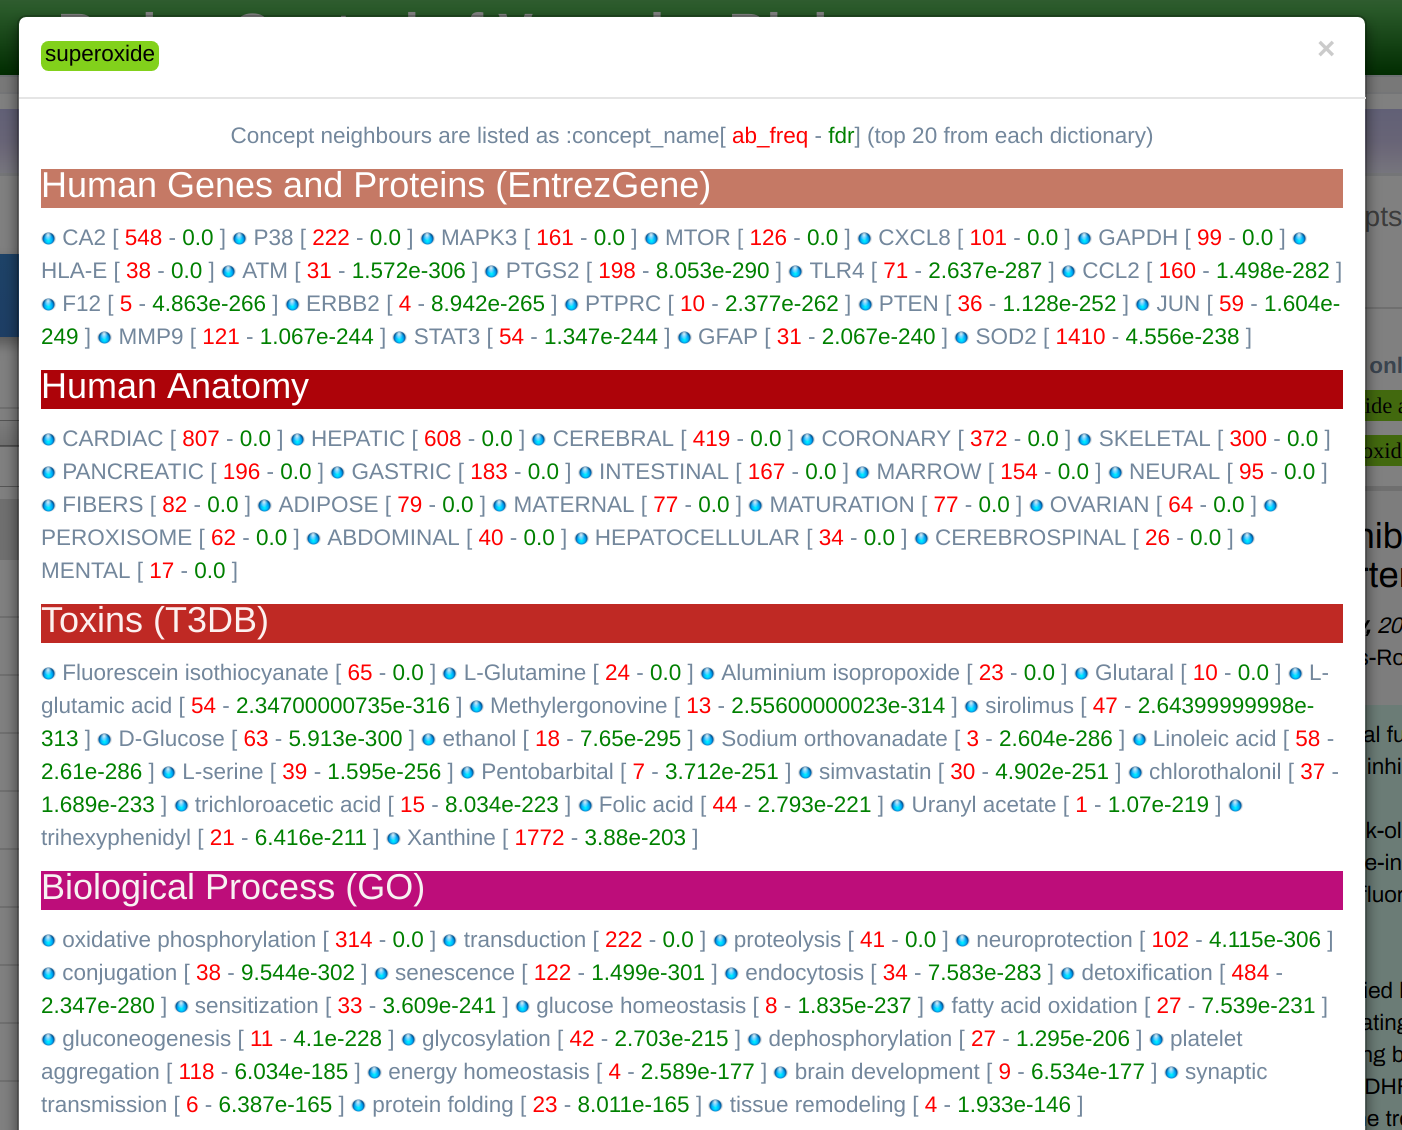
Displays associated terms categorized by Dictionary as shown in Figure 8. This is a useful and informative functionality, as the user can see the top 50 associated terms with the selected one (after p_value cut-off), organized by dictionaries. The lists can be filtered in order of frequency (raw co-occurrence counts), p-value, or PMI (Point-wise Mutual Information measure). These enriched associations are cut-off at 0.05 after the Bonferoni correction for FDR. The user can further restrict this threshold using the P_VALUE MAX input.
Enriched Term Pairs exploration mode
This exploration mode allows users to explore terms linked across multiple documents. In the simplest form, it is a simple co-occurrence of two terms in the same document. However, the information provided is much richer and displayed as a table as shown in Figure 9.
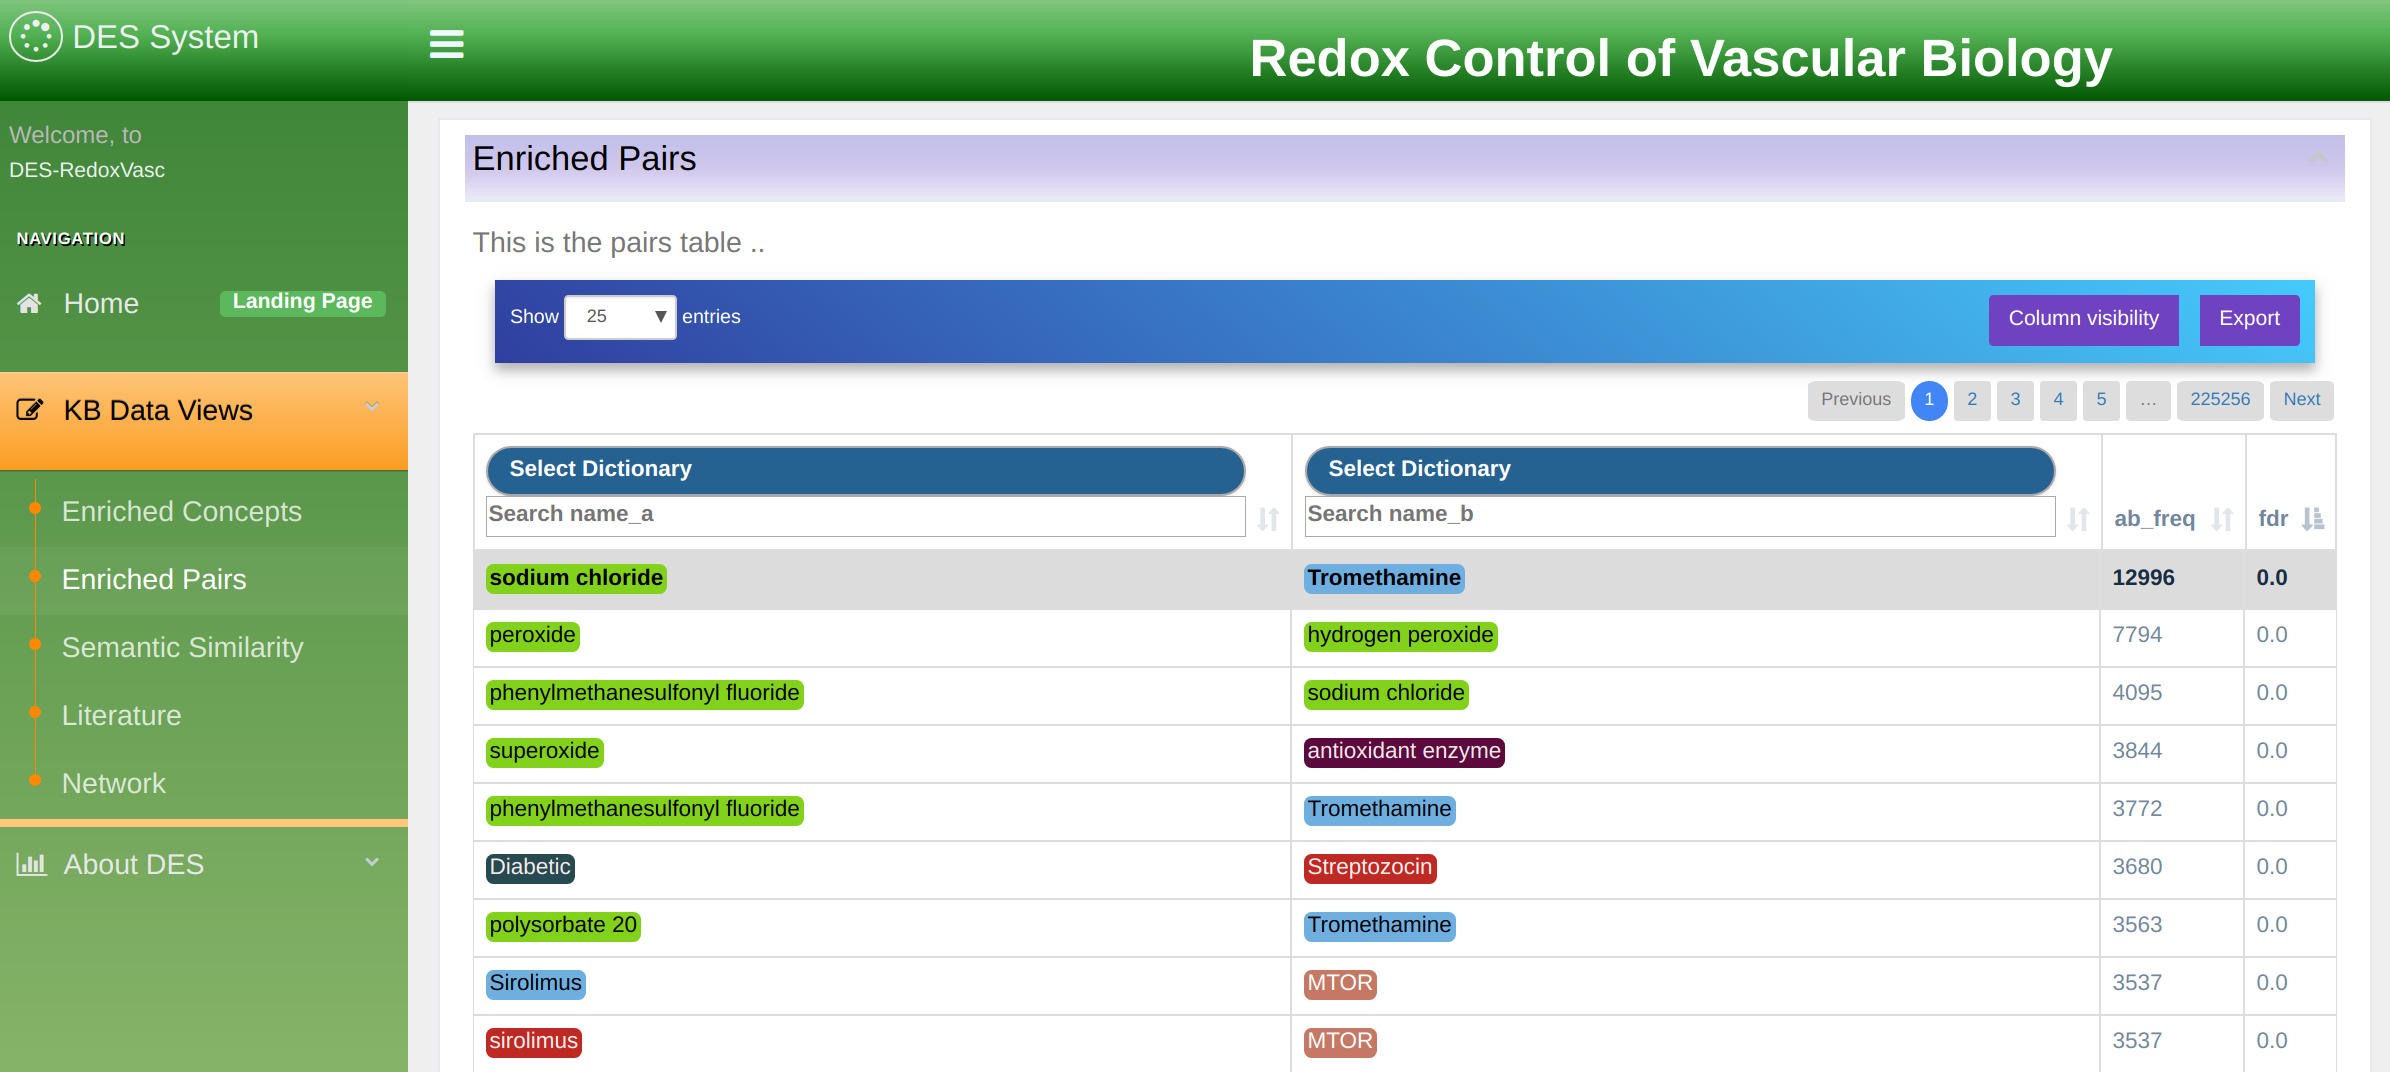
The table displays term pairs marked as A and B. Information about term association is organized in the following columns:
- FDR: False Discovery Rate. The values represent how enriched the co-occurrence of the two term is, as the probability of them co-occurring as much by chance. The p-values in this column are corrected for multiplicity testing using Boneferroni-Hochberg (FDR).
- PMI: Point-Wise Mutual Information is another measure for the strength of association of two terms based on their individual occurrence, as well as simultaneous co-occurrence within the knowledgebase.
- A Freq: term A frequency. A total count of term A name variations occurrence within the knowledgebase.
- B Freq: term B frequency. A total count of term B name variations occurrence within the knowledgebase.
- AB Freq: total number of documents within literature database where any name variation of term A co-occurs with any name variation of term B. Co-occurrence is counted at the level of title, abstract, and sentences.
- First and second dictionary selection: allows filtering terms A and B by a dictionary. Associations can be limited to one dictionary, or to a dictionary versus another, by using the 'First Dictionary' or/and 'Second Dictionary' drop-down menus.
The table can be ordered by any of its columns, and cut-offs can be applied to any of its numerical columns at the table header or footer. Terms are also searchable from the Filter input in the header. Also, individual dictionaries can be searchable at the table header/footer text inputs. Associations are first captured through raw co-occurrence counts, and then two more accurate measures are used to rank the strength of these associations. The Point-wise Mutual Information measure is a well-known metric for quantifying association in information theory and statistics:

In the above, p(x) can be thought of as the frequency of the first term (A Count column), p(y) the frequency of the second term (B Count column), and p(x,y) as the co-occurrence frequency (AB Count column). The actual values range between -1 (weakest associations) to +1 (strongest).
The associations are also ranked by the probability P((X,Y)>=AB Count | X=A Count, Y=B Count) where A and B are drawn from the constant number of articles within knowledge-base. This is calculated to be the hypergeometric p-value for enriching the less frequent concept against the more frequent one. From our observations, this seems to be a robust measure for quantifying relevant associations. The table of associations is ordered by this p-value by default. The p-value is corrected for false discovery rate using Bonferroni, and a default cutoff is applied at 0.05. Values therefore range from 0 to 0.05.
In the example shown in Figure 9 two dictionaries are selected: “ChEBI” and “Biological Process (GO)”. In addition, any of these two dictionaries could be further filtered by filling in the search boxes underneath.
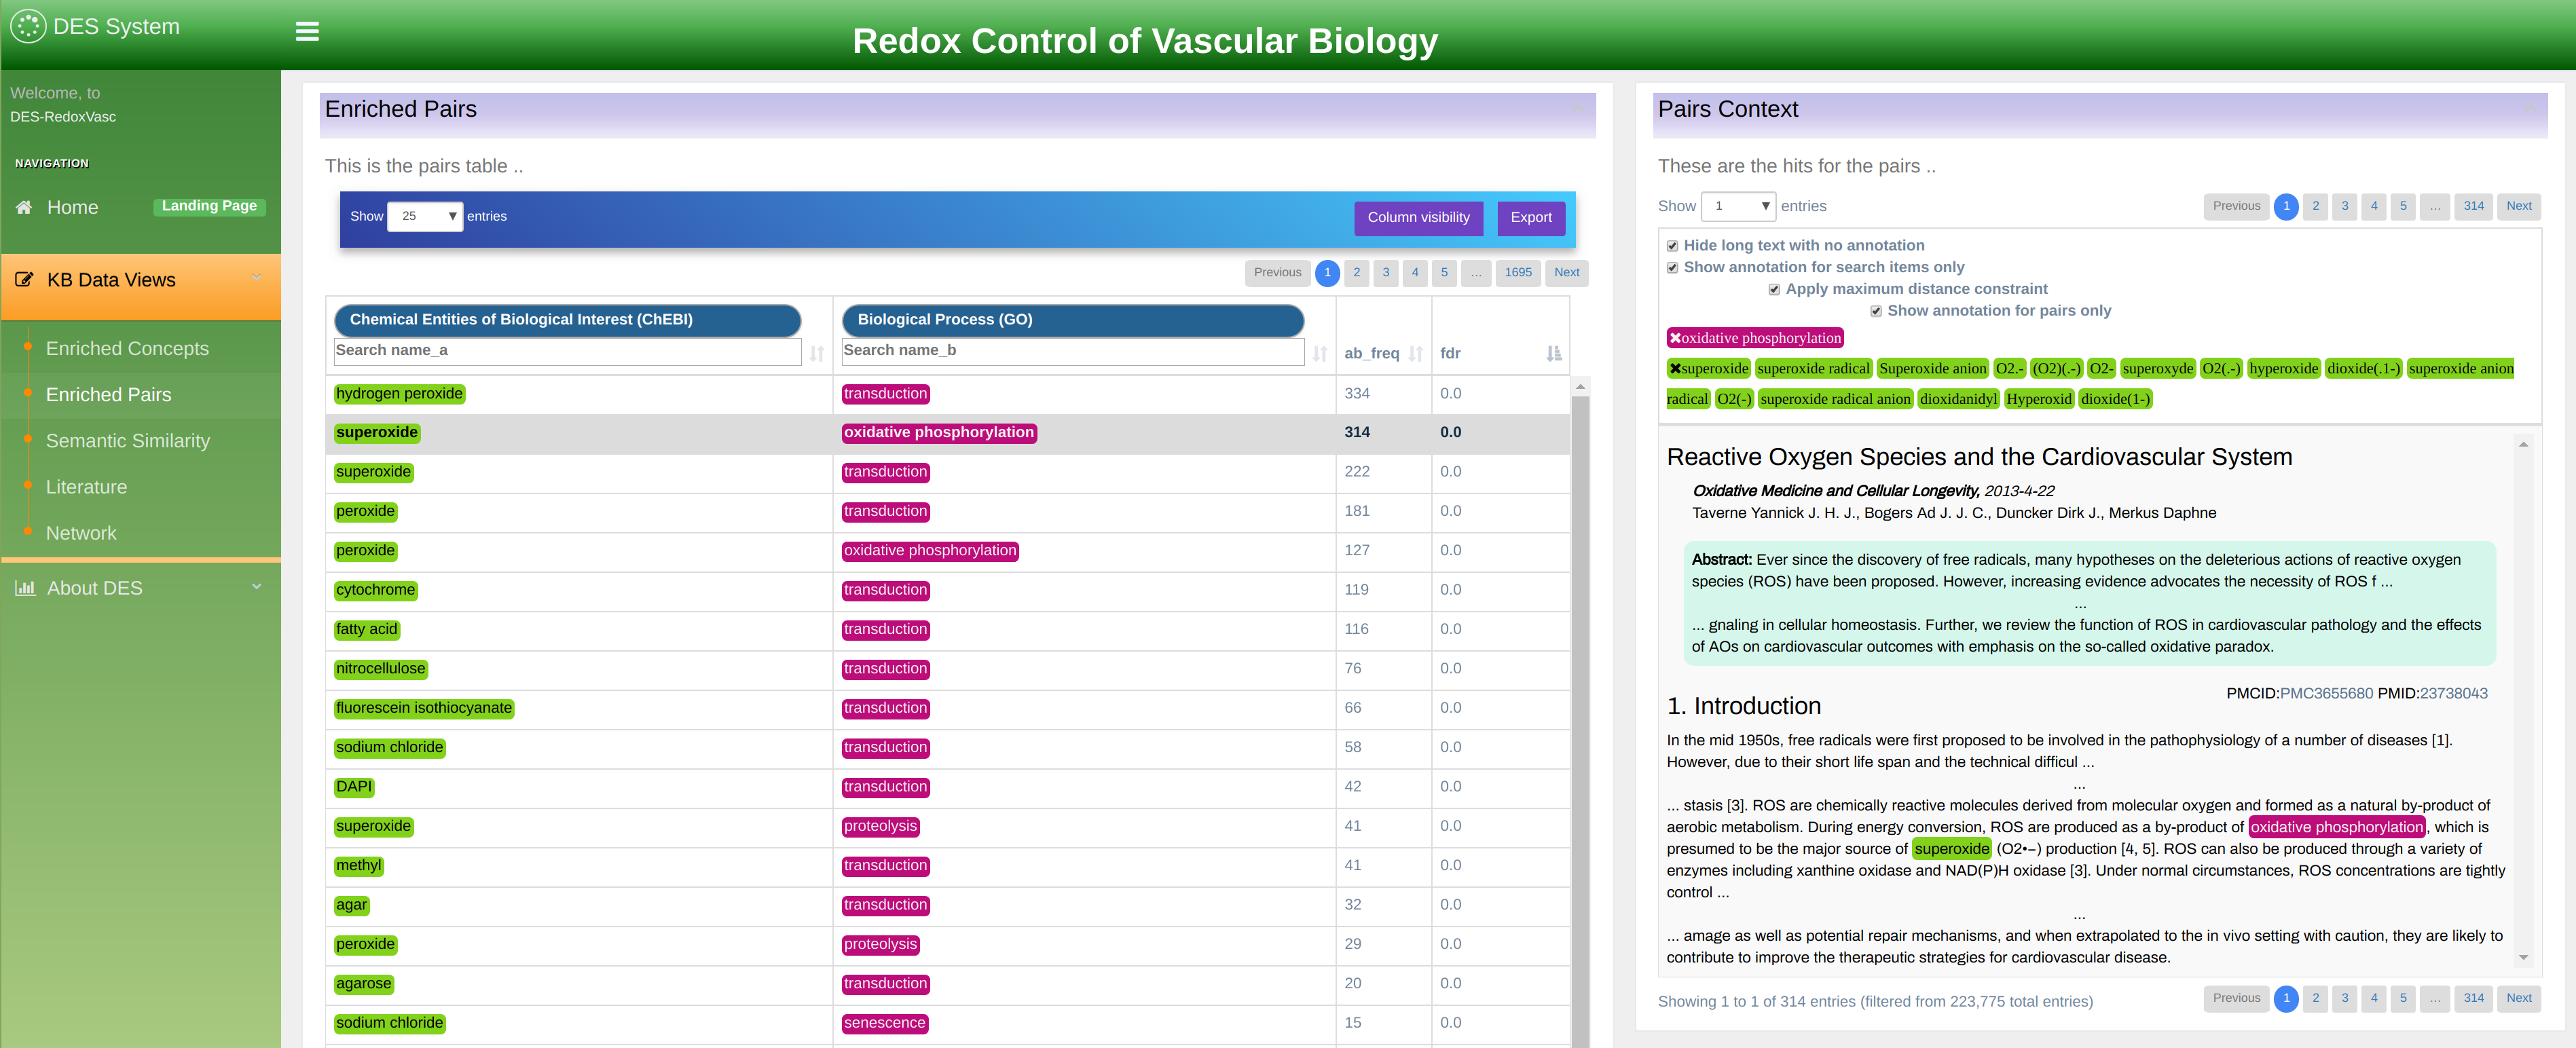
The associations within this table can be visualized as a concept centric network by right-clicking on a term and choosing the 'Network' option from a context menu. Figure 11 shows the actual network. On the top, there is a menu (dark green band at the top) you can use to control and customize the view. In addition, right-click on any of the nodes displays a context-menu (light gray menu on the figure) with the following options:
- Highlight Subnetwork: Highlights a node and its links. This enables moving the set around, or deleting it. A node is highlighted/selected by pressing a SHIFT key on the keyboard and clicking on it.
- Expand from the Term: Expands a term by showing top associated term. The number of terms shown can be controlled from the “Links filter” drop-down menu.
- Check for Co-occurrence in PubMed: Two or more terms which do not have a direct link within the network i.e are not linked within the knowledge-base can still be associated within PubMed. This can be verified by highlighting these terms (SHIFT+CLICK successively), then choosing this option from the right-click menu, which will return the number of articles within PubMed where above terms co-occur simultaneously, and a link to these articles. If no articles are found, then associations amongst such terms can be the basis for an association hypothesis.
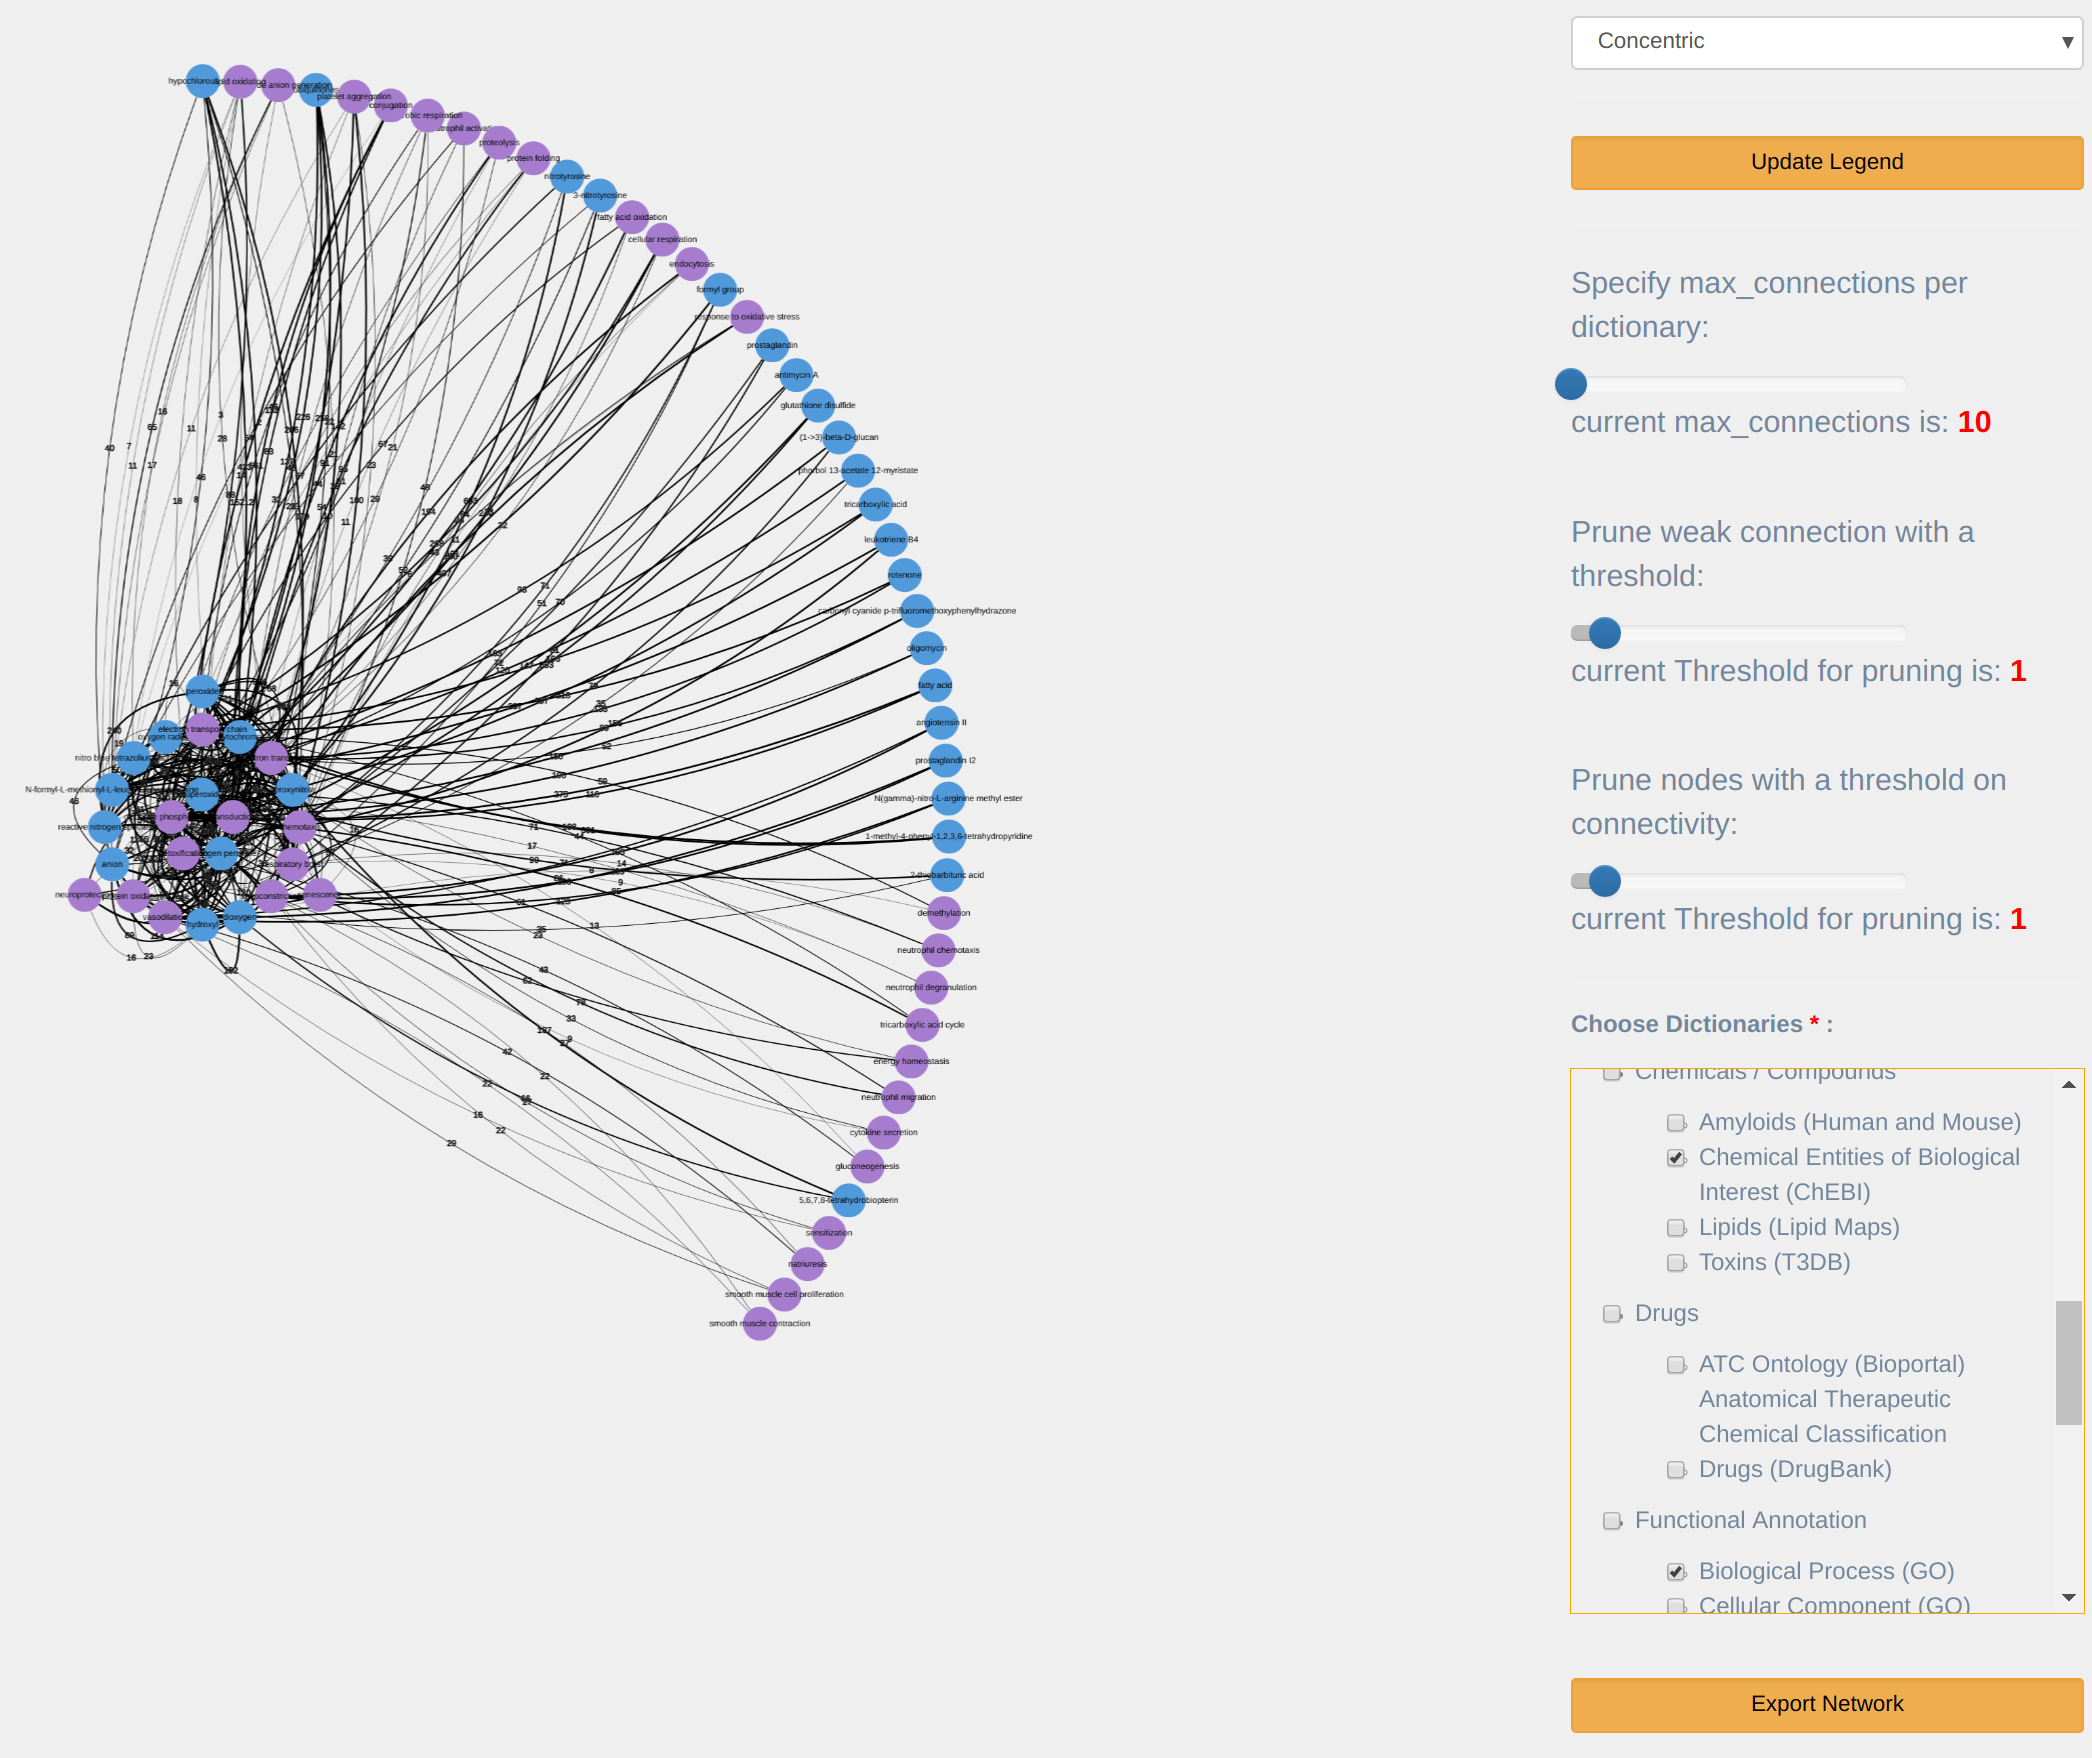
The main visualization menu (at the top) consists of number of dropdown as shown in Figure 12.
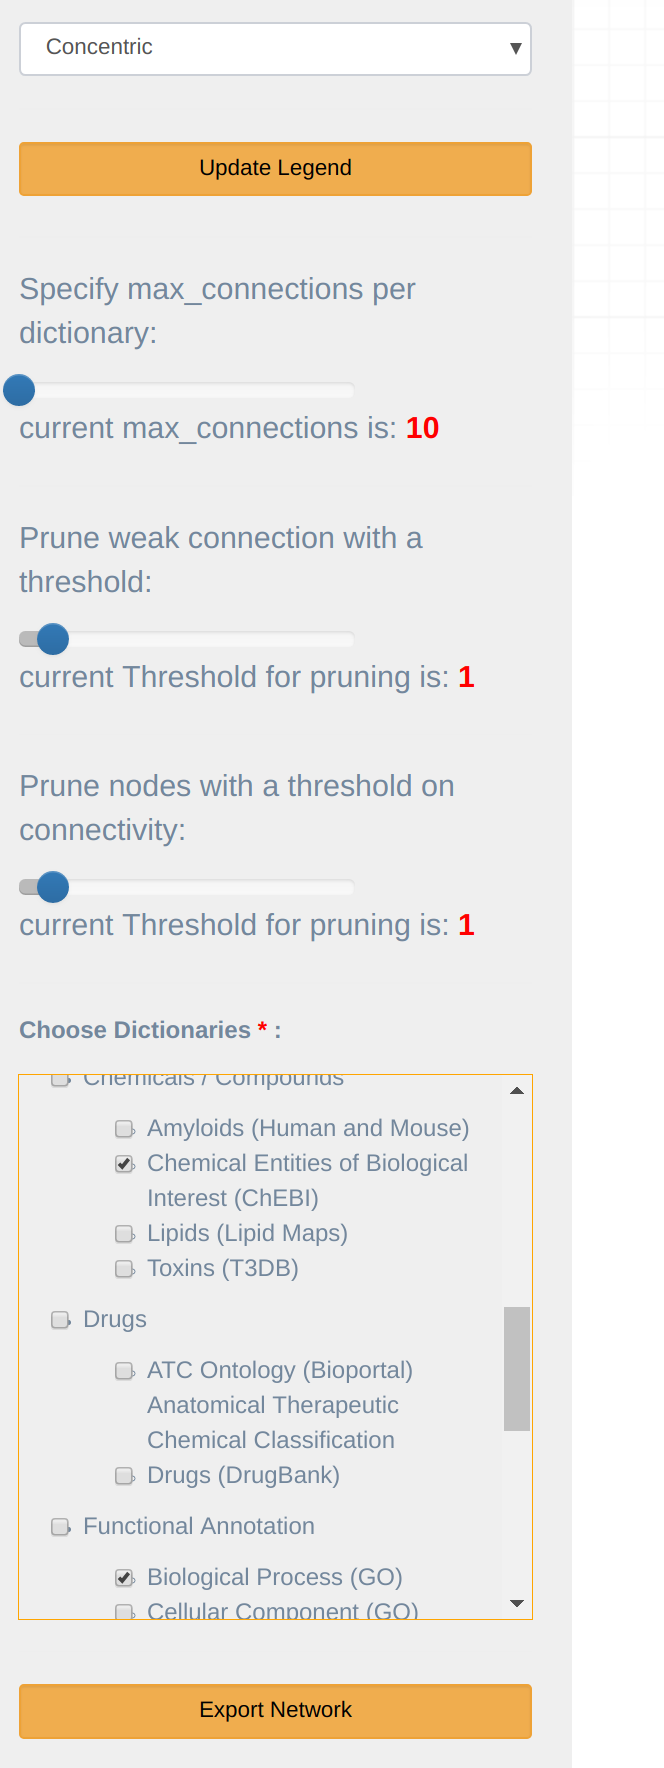
Links filter: allows filtering links between terms according to the following criteria:
- Specify max connections: maximum Nodes, when specified, only the top 'Maximum Nodes' associated with the terms are displayed. The default is 10.
- Prune weak connections: with a minimum PubMed Links, shows only links where term co-occurrence exceeds the specified threshold.
- Prune connectivity: prune nodes that have fewer than set amount of connecting nodes
Dictionaries: allows filtering particular dictionary in/out of the network visualization.
Select Layout: provides a number of network layouts that the user can choose from:
- Circle: Fit the whole graph in a circle.
- Force directed non-proportional: aesthetically pleasing graph with a random layout.
- Force directed proportional: same as the previous but the links length is proportional to the number of co-occurrences in a common literature.
- Radial: place the term of interest in the middle and co-occurring terms in a circle around.
- Tree: the term of interest is the root and co-occurrence terms are drawn in branches.
Export the network: exporting the network graph into a portable image format (.png).
Reset the network: first right-click on network area, then you can return to the original node and its associations.
Semantic Similarity
Semantic similarity is a metric which establishes the likeness or closeness of two concepts in terms of their meaning. Semantic similarity can be the result of semantic relatedness, such as synonymy, antonymy, hypernymy, etc. For example, tall and short are semantically similar even though they are antonyms because they both share the semantic dimension of ‘height’.
Semantic similarity within DES is calculated as the cosine distance between two concept embeddings (vector representations in a latent semantic space). These embeddings are obtained using a skip-gram Word2Vec model trained on the DES-RedoxVasc literature corpus with normalized concept annotation. Therefore, the underlying assumption for semantic similarity in DES is concept co-occurrence, but not necessarily direct co-occurrence.
As a functionality within the DES interface, semantic similarity is used as a measure for sorting the KB concepts (the table on the right) according to this similarity metric with respect to a chosen concept (selectable from the table on the left) in Figure 13. Note that top hits for a chosen concept are potential association candidates, which may or may not have a direct co-occurence with it in within the text.
Literature exploration mode
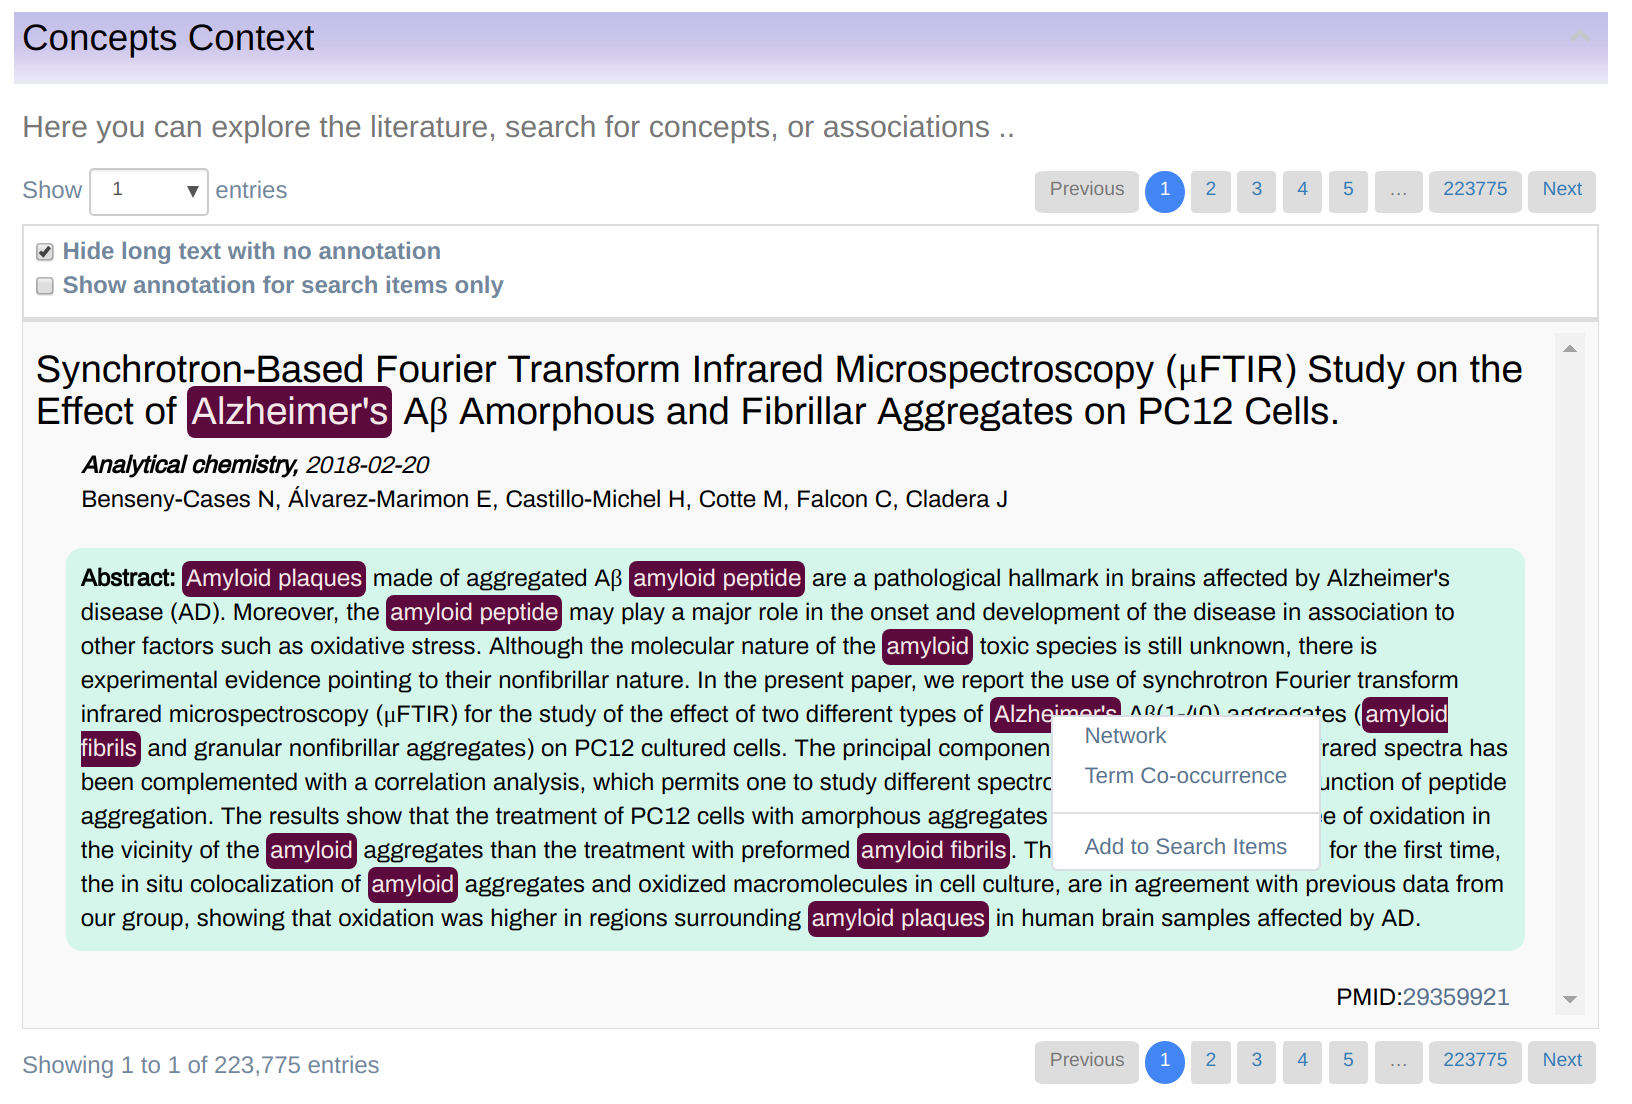
This page allows literature search by selected terms or dictionaries. Figure 14 shows such search where Mutations (tmVar) dictionary and Cancer are selected as search keywords. Search keywords are displayed in the line bellow the search box and can easily be removed by clicking on the “x” button. A new keyword can be added by typing it in the input box. Autocomplete feature automatically opens all relevant terms you can choose from. The result of the search is a list of PubMed and PubMed Central articles relevant to your search. All term of interest is highlighted in the text. In addition, right-click on the term bring the visualization submenu expanded with an extra feature “Add to Key Terms” that ads clicked terms into search criteria. Literature search example

Conclusion
DES KBs are free for academic and nonprofit users. Users can exploit the knowledgebase by using any of the mainstream web browsers, including Firefox, Safari and Chrome. However, as far as we know, the only feature with browser inter-compatibility issues is the network export option that is only available through Chrome.